BMR explained: why muscle sets how much you burn at rest
What basal metabolic rate is, why a BMR calculator can miss you, how lean mass changes the answer, and what honestly raises it, from muscle to slower diets.

Basal metabolic rate, or BMR, is the energy your body burns at complete rest just to stay alive: breathing, circulating blood, running your brain and organs, keeping you warm. For most people it is the largest part of what they burn in a day. And after your overall size, the biggest thing that sets it is how much lean tissue you carry.
That is why two people of the same age, height and weight can have noticeably different BMRs, and why a BMR calculator that only asks for those four things can be off for you. Here is what BMR is, how it is estimated, why muscle matters, and what genuinely moves it.
The short version
- BMR is your resting burn. It is usually the biggest slice of your daily energy use, bigger than exercise.
- Most calculators use weight, height, age and sex. Lean-mass formulas, and a body composition scale, account for what that weight is made of.
- Muscle raises BMR modestly. Keeping muscle while you lose weight matters far more than any metabolism trick.
What BMR is, and where it fits in your day
The energy you use in a day has three parts. BMR keeps you running at rest. Digesting food costs a little more, roughly a tenth of the total for most people. Everything else is movement: workouts, but also walking to the bus, climbing stairs, cooking and fidgeting.
This is the logic behind official energy requirements. The FAO, WHO and UNU expert report on human energy requirements builds daily needs by multiplying BMR by a physical activity level. ICMR-NIN’s nutrient requirements for Indians use the same approach. Your BMR is the base everything else stacks on.
Strictly, BMR is measured under tight conditions: lying down, in the morning, rested and fasted, in a comfortable room. Resting metabolic rate, or RMR, is the looser everyday version and runs a little higher. Most apps and articles, including this one, use the terms loosely.
BMR calculator vs a reading based on your body
The standard calculator
Most online BMR calculators use the Mifflin–St Jeor equation, published in 1990. For men it is 10 × weight in kg + 6.25 × height in cm − 5 × age + 5. For women, the last term is −161 instead of +5. A 2005 systematic review found it the most reliable of the common equations for healthy adults, while noting that it can still miss an individual by a meaningful margin.
The weakness is built in. The equation knows how much you weigh, but not what that weight is made of. Fat and muscle count the same.
Formulas that use lean mass
In 1980, a reanalysis of classic metabolism data found that lean body mass was the single best predictor of BMR; once it was known, age and sex added little. Formulas built on that idea, such as Katch–McArdle, start from lean mass: 370 + 21.6 × lean body mass in kg. Feed them a muscular person and a softer person of the same weight, and they give different answers.
What “measured” really means
A truly measured BMR comes from a laboratory test called indirect calorimetry, which reads the oxygen you use and the carbon dioxide you breathe out while you lie still. It is accurate, but few people will ever have one.
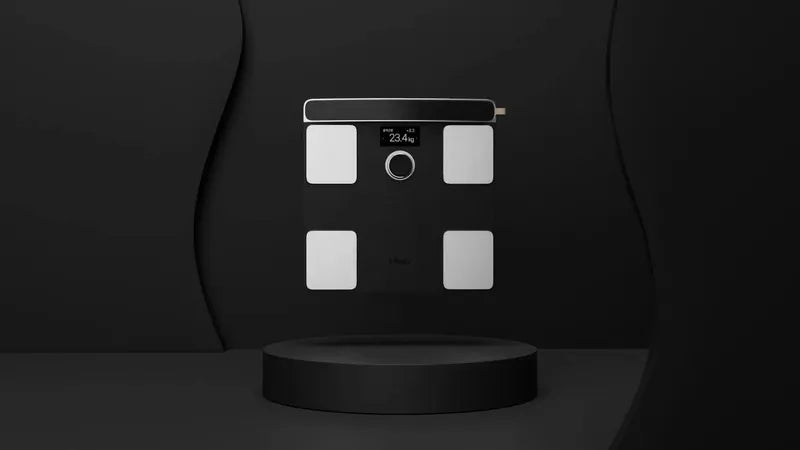
A body composition scale sits in between. It does not measure your breathing. It measures your lean mass and calculates BMR from it, so the number follows your body rather than population averages. A Dial reports BMR in kcal at every test, and when your muscle changes, your BMR moves with it.

Why muscle sets the pace, and by how much
Kilo for kilo, your organs burn the most: brain, liver, heart and kidneys are small but busy. Their size barely changes in adult life, though. Skeletal muscle is the large lean tissue that does change, with training, with dieting and with age, so it is the part of your BMR you can influence.
Be realistic about the size of the effect. Muscle burns about three times as much as fat at rest, but the totals are modest: researchers put skeletal muscle at about 13 kcal per kilo per day. Two extra kilos of muscle add roughly 25 kcal to your resting burn, about a biscuit. The bigger value of muscle is what it lets you do, and what you lose without it. Our guide to metabolic age and the InBody Score covers the other numbers built on BMR.

Age gets blamed for a slow metabolism, often unfairly. A 2021 study in Science pooled measurements from more than 6,000 people and found that, once body size and composition were accounted for, energy use held steady from about 20 to 60 and declined only after that. In midlife, a falling BMR usually tracks lost muscle and less movement more than birthdays.
How to increase your BMR, honestly
There is no switch. There are a few levers that work slowly and add up.
- Build muscle, and keep it. WHO recommends muscle-strengthening activity on two or more days a week. Squats, push-ups, rows with a band and carrying shopping up the stairs all count.
- Eat enough protein. ICMR-NIN puts the requirement for healthy Indian adults at 0.83 g per kilo of body weight a day. Protein also costs more energy to digest than carbohydrate or fat.
- Lose weight slowly. Very large calorie cuts make it harder to hold on to muscle, and the body adapts by burning less.
- Move more through the day. Walking and standing do not raise BMR, but they raise your total burn, which is what your weight responds to.
- Check the basics. Sleep, stress and illness all play a part. If your weight or energy changes without explanation, talk to your doctor.
The third point deserves a word of caution. When researchers followed contestants from an extreme televised weight-loss competition for six years, their resting metabolism was still far lower than their body size would predict. That was an unusual, extreme case, but the direction is common: the faster and harder you diet, the more your body fights back. It is one reason weight loss slows, as our guide to the weight-loss plateau explains.

Tracking BMR on a Dial
Every Dial, from H20 to H40, reports basal metabolic rate at every test, worked out from your lean mass. On its own, a single day’s BMR is not very interesting. As a trend, it tells you something useful, especially while you are losing weight.
- BMR and skeletal muscle falling together means your weight loss is taking muscle with it. Add protein and strength work.
- BMR steady while body fat falls means you are keeping the lean tissue that matters.
- BMR drifting down with age and no change in weight often means muscle is quietly being replaced by fat.
For context on what sits behind the BMR figure, see lean body mass and skeletal muscle mass.
 Dial H20For just you. BMR, skeletal muscle mass, body fat and visceral fat: 8 readings in about 10 seconds.See Dial H20 →
Questions people ask
What is a good BMR for my age?
There is no single good number. BMR depends on your size, sex and especially your lean mass, so two healthy people of the same age can differ a lot. Compare your BMR with your own earlier readings, not with a chart.
Are online BMR calculators accurate?
For an average person they are a reasonable starting point. Mifflin–St Jeor is the most reliable of the common equations, but it cannot see muscle or fat, so it can be off for very muscular people and for people with high body fat at a normal weight.
Should I eat my BMR in calories?
No. BMR is only your resting burn; your daily needs include digestion and movement on top. Eating far below your needs for long stretches makes it harder to keep muscle. A registered dietitian can set a target for you.
Does metabolism slow down after 30 or 40?
Less than people think. A large 2021 study found energy use, adjusted for body size and composition, stayed steady from about 20 to 60. Midlife slowdowns usually come from losing muscle and moving less.
Can I measure my BMR at home?
Not directly; that takes a lab test of your breathing. A body composition scale estimates it from your measured lean mass, which tracks your body more closely than a calculator that only knows your weight.
Sources
- Mifflin MD, St Jeor ST, Hill LA, Scott BJ, Daugherty SA, Koh YO. A new predictive equation for resting energy expenditure in healthy individuals. American Journal of Clinical Nutrition 1990;51(2):241–247.
- Frankenfield D, Roth-Yousey L, Compher C. Comparison of predictive equations for resting metabolic rate in healthy nonobese and obese adults: a systematic review. Journal of the American Dietetic Association 2005;105(5):775–789.
- Cunningham JJ. A reanalysis of the factors influencing basal metabolic rate in normal adults. American Journal of Clinical Nutrition 1980;33(11):2372–2374.
- Wang Z et al. Specific metabolic rates of major organs and tissues across adulthood: evaluation by mechanistic model of resting energy expenditure. American Journal of Clinical Nutrition 2010;92(6):1369–1377.
- Pontzer H et al. Daily energy expenditure through the human life course. Science 2021;373(6556):808–812.
- Fothergill E et al. Persistent metabolic adaptation 6 years after “The Biggest Loser” competition. Obesity 2016;24(8):1612–1619.
- Westerterp KR. Diet induced thermogenesis. Nutrition & Metabolism 2004;1:5.
- FAO, WHO, UNU. Human energy requirements: report of a joint FAO/WHO/UNU expert consultation. Rome: FAO; 2004.
- ICMR-NIN, Nutrient Requirements for Indians: Recommended Dietary Allowances and Estimated Average Requirements, 2020.
- World Health Organization. WHO guidelines on physical activity and sedentary behaviour. Geneva: WHO; 2020.
 Dial H40
 Dial H30
 Dial H20